Published by Dr. Brian O’Donnell | Aurex Insights
Drafted 31 March 2026, for publication 1 April 2026. Data and forecasts current as of 31 March 2026.
The global oil shock 2026 has seized the macro narrative. Brent crude is trading a little above 104 USD per barrel, roughly 34 – 40% higher than a month ago, with front‑month WTI around 102 USD. Prices are whipsawing on every headline as the Iran – US – Israel conflict grinds on, missile and drone attacks continue around the Gulf, and shipping through the Strait of Hormuz remains disrupted and more expensive. Iran now exerts de facto control over key lanes and is extracting a mix of “tolls” via transit fees, war‑risk premia and rerouting costs.
This is one of the most serious energy shocks since the early 2000s. It is tempting to reach for the 1970s analogy: expensive oil, geopolitical conflict and political pressure on central banks. The comparison is understandable – but also misleading. Today’s shock is severe, yet it is hitting a very different global economy, and that matters enormously for inflation, growth and policy.
Global oil shock 2026: why this is not the 1970s.
At the same time, the question everyone asks – how will this war end, and when? – is not answerable in any precise way. What we can do is map the economic consequences of different paths, and show how they feed through into inflation, interest rates, food prices and real incomes – and how central banks and international institutions are already stress‑testing those risks.
Today’s oil market snapshot
As of the end of March 2026:
- Brent crude: about 104 USD per barrel, up roughly 34 – 40% over the past month.
- WTI: just above 100 USD per barrel, with similar gains.
- ECB March 2026 projections assume oil averaging around the low‑80s USD this year, with a peak close to 90 USD in Q2 before easing – materially below current spot levels.
- The IMF still sees global growth around 3.3% but describes the Middle East oil shock as “testing resilience again”, especially for energy‑importing Europe and Asia.
What happens next will depend less on any single day’s price print and more on the duration of Strait of Hormuz disruption, the scale of physical damage to infrastructure, and political choices in Washington, Tehran, the Gulf and Beijing.
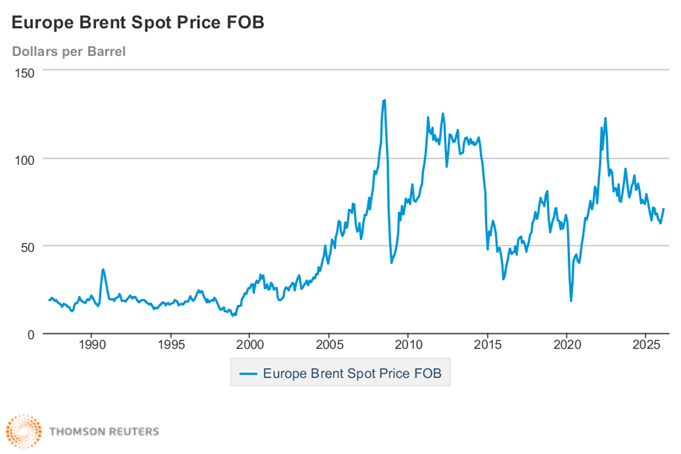
The chart above shows that, even in historical terms, today’s Brent price spike is sharp but not unprecedented: oil has traded above 100 dollars repeatedly since the early 2000s, with a clear sequence of peaks around 2008, 2012 and 2022. What happens next will depend less on any single day’s price print and more on the duration of Strait of Hormuz disruption, the scale of physical damage to infrastructure, and political choices in Washington, Tehran, the Gulf and Beijing. Link: https://tradingeconomics.com/commodity/brent-crude-oil
Why the 2026 oil shock is not the 1970s
1. We already had the big inflation shock
Between 2020 and 2025, consumer prices rose by roughly low‑20s percent in most advanced economies, driven first by pandemic re‑opening and supply bottlenecks, then by Russia’s invasion of Ukraine. Central banks responded with the fastest rate‑hiking cycle in decades, and headline inflation has fallen back towards 2 – 3% across the euro area, North America and much of the OECD, even though the price‑level step change remains.
Two consequences matter for today’s oil shock. First, real incomes are still in repair mode; households and SMEs are not embarking on a new consumption boom, they are rebuilding balance sheets. Second, medium‑term inflation expectations are better anchored than in the 1970s, thanks to inflation‑targeting regimes, less automatic wage indexation and more independent central banks. An energy shock landing on an economy that has already absorbed one major inflation episode behaves very differently.
2. We have seen multiple oil spikes since the 1980s
Since the early 1980s, the world has seen at least eight major oil spikes where prices jumped 50% or more in a short period – including the 1990 Gulf War, the 1999 – 2000 and 2007 – 08 run‑ups, and post‑Arab Spring episodes. Those episodes raised inflation and hurt growth, but they did not recreate 1970s‑style stagflation.
Two structural changes helped: independent central banks reacted faster, signalling intolerance for persistent inflation, and oil markets became more flexible, with deeper futures markets and more non‑OPEC supply. Oil shocks have become a recurring macro risk to be managed, not a one‑off regime change.
3. Our economies are more services‑heavy and less energy‑intensive
Advanced economies today are dominated by services – IT, finance, healthcare, tourism, professional services – rather than heavy industry. Energy‑intensive production has shrunk or moved, while energy efficiency has improved dramatically, so each unit of GDP now requires far less oil and gas than in the 1970s.
Energy prices still matter – especially for transport, logistics, agriculture and parts of manufacturing – but the pass‑through from an oil spike into overall inflation is smaller, and the drag on GDP for a given price level is lower, than in the past. That is why repeated post‑1980 spikes have dented growth and lifted prices without triggering a full 1970s replay.
Across advanced economies, energy intensity (energy use per unit of GDP) has fallen by roughly half since the first oil‑shock era. This is one of the most robust findings in energy economics: international data from the IEA and OECD show a sustained decline in energy used per unit of output since the early 1970s, driven by efficiency improvements, structural shifts toward services, and technological change
Energy security in Ireland: oil, gas and transport
Ireland is a useful stress test for European energy security because it combines a modern services economy with one of the highest dependencies on imported fossil fuels in the EU. Over the past decade, Ireland’s energy strategy has often mixed high‑ambition rhetoric with uncomfortable dependence on others. We oppose domestic fracking yet rely on imported LNG for security; we reject nuclear at home yet import electricity from a UK system where nuclear is a core baseload technology. The result is a small, open economy that talks like a climate leader but still depends on external suppliers for the overwhelming majority of its energy – a combination that leaves us acutely exposed when global shocks hit.
The scale of that exposure stands out even in a European context:
- Ireland’s energy import dependency rate is consistently among the highest in the EU, running at around 70–75% of gross inland energy consumption in recent years, well above the EU average of roughly 55–58% (Energy Environmental Indicators Ireland 2025 – Economy, Emissions and Energy – Central Statistics Office).
- Fossil fuels still dominate Ireland’s energy system. In 2024, they supplied 81.4% of total energy demand, while 79.7% of Total Primary Energy Requirement was met through imports – leaving Ireland among the most energy‑import‑dependent economies in the EU. That is a stark reminder that, despite years of climate ambition, renewable progress has not yet penetrated deeply enough into transport and heat to deliver genuine energy security.
- Oil accounts for just over half of Ireland’s energy use (around 51% in recent CSO data), making Ireland one of the most oil‑reliant countries in the entire EU.
- Diesel and petrol made up 93% of transport fuels last year; overall, 94% of transport energy still came from fossil fuels.
- Ireland has no domestic oil or gas production to speak of, no strategic gas storage facility of its own, and no interconnected pipeline to continental Europe – relying instead on a single Moffat gas interconnector from the UK and periodic LNG spot cargoes.
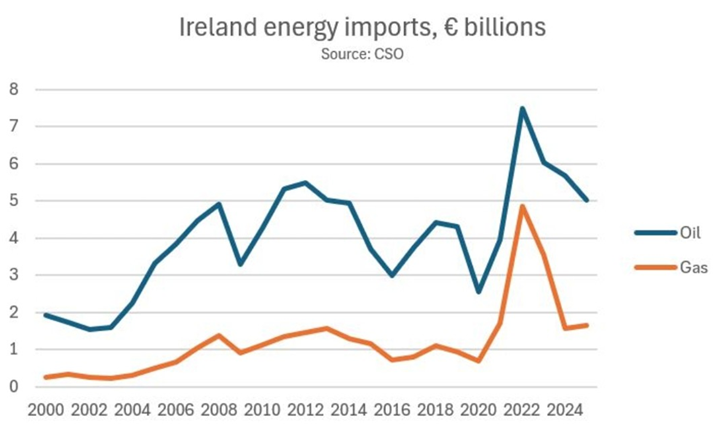
The chart above shows how Ireland’s oil and gas import bill has surged and then only partially retreated over the past two decades, peaking at more than €12 billion in 2022 before easing to around €6.7 billion in 2025, according to CSO data. Put simply, Ireland has a digital, services‑led economy running on a transport and heating system that still relies overwhelmingly on imported oil and natural gas.
That leaves Ireland acutely sensitive not just to the global oil price, but to gas prices and to disruptions in fertiliser, food and shipping markets that depend on the same Middle East chokepoints now under pressure. When we talk about “Ireland energy security” in 2026, we are talking about both crude oil and the natural‑gas‑fertiliser‑food chain.
What makes this especially frustrating is the scale of Ireland’s untapped natural advantage. Ireland sits on one of the windiest and most wave‑energetic coastlines in the world, with some of the best offshore wind resources in Europe. The potential is enormous – yet despite years of climate commitments and ambitious government targets, the translation of that resource into real energy security has been painfully slow, hampered by planning delays, grid constraints, slow permitting and a lack of the long‑term strategic vision that the scale of the opportunity demanded. In the middle of the global oil shock 2026, that gap between rhetoric and reality is difficult to defend.
Ireland’s energy vulnerability – its import dependency, its fossil‑fuel‑heavy transport system, its absence of strategic storage, and its failure to fully harness world‑class renewable resources – deserves a deep dive of its own, well beyond the scope of this article. What is clear is that this global oil shock has exposed a structural weakness that no amount of short‑term subsidy can fix; only sustained, strategic investment in energy independence will.
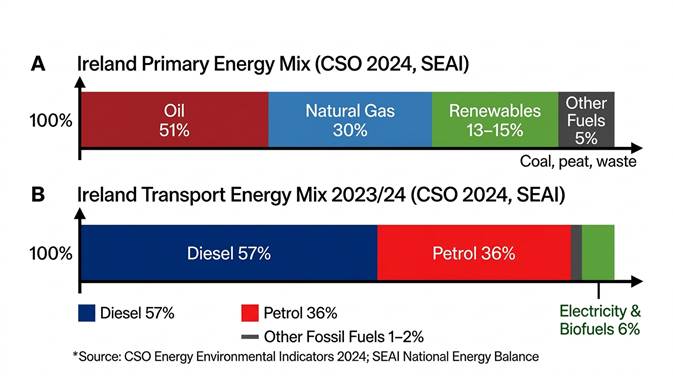
As the illustration above shows, oil still supplies about 51% of Ireland’s primary energy, with natural gas around 30%, renewables about 13 – 15% and other fuels the remaining 4 – 6%, according to recent CSO and SEAI data. In transport, the picture is even starker: roughly 94% of energy use still comes from fossil fuels, with diesel accounting for about 56–58%, petrol 35–37% and other fossil fuels a small residual share, while electricity and biofuels together make up only about 6%. CSO Environmental Indicators Ireland 2025: https://www.cso.ie/en/releasesandpublications/ep/p-eiieee/environmentalindicatorsireland2025economyemissionsandenergy/
ECB March 2026 scenarios: oil, inflation and growth
The ECB’s March 2026 staff projections explicitly build energy scenarios on top of a baseline. Link: https://www.ecb.europa.eu/press/projections/html/ecb.projections202603_ecbstaff~ebe291cd3d.en.html
- Baseline scenario: assumes average oil prices around the low‑80s USD per barrel this year, with a peak close to 90 USD in Q2 before drifting lower; euro‑area inflation averages about 2.6% in 2026 and 2.0% in 2027.
- Adverse scenario: assumes deeper disruption to the Strait of Hormuz, with oil peaking near 119 USD and gas prices also higher, then normalizing from late 2026; inflation ends up roughly 0.9 percentage points higher in 2026 than in the baseline, with weaker but still positive growth.
- Severe scenario: assumes a roughly 60% decline in shipments through Hormuz, some destruction of energy infrastructure, and oil peaking at about 145 USD, with prices elevated for longer and growth slower, but no outright depression.
In other words, the ECB is already modelling worlds worse than where we stand today – and even there, the central view is “higher‑for‑longer inflation and slower growth”, not macro collapse.
The IMF adds a simple rule‑of‑thumb: a 10% increase in energy prices sustained for a year tends, on average, to add about 0.4 percentage points to global inflation and shave 0.1 – 0.2 points off growth. That gives a clean link between higher oil and gas prices and headline inflation in 2026–27. Link: https://www.bloomberg.com/news/articles/2026-03-06/imf-says-ready-to-help-economies-squeezed-by-mideast-oil-shock
How long will the war’s economic effects last?
The honest answer is that no‑one can date the end of the conflict. Politicians talk in terms of “weeks, not months” to anchor expectations, but serious forecasters focus on the duration of disruption to infrastructure and to Strait of Hormuz shipping, not on the official end of combat operations.
From an economic‑policy perspective, three broad paths capture most plausible outcomes over the next 6 – 12 months:
- Managed de‑escalation (best case)
- Diplomacy plus credible naval escorts gradually reopen normal shipping lanes through Hormuz.
- Brent “global oil shock 2026” fades into a 90 – 100 USD band as risk premia compress and stocks rebuild.
- Macro impact: a visible hump in 2026 inflation and a squeeze on real incomes, fading into 2027; central banks largely “look through” the shock.
- Prolonged standoff / “pay‑to‑pass corridor” (base case)
- Hormuz does not close outright but remains constrained; some vessels pay substantial, opaque fees and others avoid the area.
- Brent oscillates in a 95 – 115 USD range, with frequent headline‑driven spikes and sharp dips when diplomacy appears to gain ground.
- Macro impact: like the ECB’s adverse scenario – euro‑area inflation perhaps 0.5 – 1 percentage point above baseline in 2026, weaker growth but no collapse, and intense pressure for fiscal support.
- Escalation / effective blockade (serious tail risk)
- The conflict widens, infrastructure is hit harder and Iran moves closer to a declared closure of Hormuz to non‑allied shipping.
- Brent pushes into the 115 – 140 USD zone, with intraday spikes possibly above 150 USD before demand destruction and policy responses cap the move.
- Macro impact: much closer to the ECB’s severe scenario, with significantly higher and more persistent inflation, materially weaker growth, and severe fiscal strain.
Politically, all three paths share one awkward fact: none offers a quick, clean “end” to the crisis. Even in the best case, trust and normality in Hormuz may take years to rebuild.
Natural gas, fertiliser and food prices: the 6 – 9-month lag
The global oil shock 2026 is not just about petrol and diesel. Natural gas has quietly become the world’s most important food input. Gas is the primary feedstock for nitrogen fertiliser, and around 80% of the variable cost of producing ammonia and urea is the gas bill. When gas prices spike or Gulf LNG facilities are damaged, the economics of fertiliser plants can flip from marginally profitable to uneconomic almost overnight.
The business arithmetic follows a predictable sequence:
- Energy prices spike immediately.
- Within about three months, fertiliser costs surge and farmers cut application rates.
- Around six months later, yields fall because soils were under‑fertilised.
- After roughly nine months, natural‑gas‑linked fertiliser costs show up fully in food prices at the supermarket.
Even if oil or gas prices fall back before harvest, the damage is already “baked in” by earlier fertilizer decisions. That is why “natural gas fertilizer food prices” is the crucial chain to watch in late 2026 and 2027.
For Ireland, this global oil shock 2026 matters twice over. We are both a high‑cost food producer plugged into global markets and a small open economy where households devote a significant share of their budgets to food and energy. A prolonged war that keeps LNG from Qatar tight or raises war‑risk premia on fertilizer shipments through the Strait of Hormuz would not just raise farm input costs; it would compress margins for Irish farmers, strain emerging‑market food importers, and push up the grocery bill for Irish households with a lag.
Ireland typically needs in around 1.2 million tonnes of fertiliser for a season. Current industry reports suggest that around 50 – 60% of the requirement for the 2025–26 season is already in the country – either on farm or in merchants’ yards – which cushions the immediate risk but still leaves a large balance (around 500,000T) to be bought on a much more uncertain market. With nitrogen benchmarks already up 20 – 30% since the Middle East war escalated and seaborne urea approaching 700 USD per tonne in some trades, most analysts expect European fertiliser offers to move well beyond the roughly €500‑per‑tonne levels seen in late February if Gulf disruptions drag on through the year, especially given the region’s outsized role in traded ammonia and urea.
This timeline shows how an energy price shock turns into higher food prices with a 6–9 month delay, as costly gas drives up fertiliser, farmers cut application, yields fall at harvest and supermarket prices rise.
A simple way to summarize this section for readers is: “One hundred‑dollar oil doesn’t scare us like it used to – but five to eight‑hundred‑euro fertilizer should.”
Politics, policy and the distribution of pain
If the oil market itself is not yet screaming “1970s”, where are the genuine dangers?
- Domestic responses: High fuel prices are politically toxic. Governments reach for broad subsidies, temporary fuel‑tax cuts, lump‑sum rebates or windfall taxes. These can ease immediate pain, especially for vulnerable households and energy‑intensive SMEs, but they blunt price signals, strain public finances and risk prolonging the inflation impulse if not carefully targeted and time‑limited. In the last few days, this has moved from theory to guidance. The International Energy Agency is explicitly urging governments to promote remote working, public transport and less air travel to cut oil demand, and the European Commission has written to energy ministers calling for coordinated voluntary fuel‑saving measures, especially in transport, while warning against uncoordinated steps that worsen consumption or fragment the single market. Calls from EU Commissioners for people to work from home where possible and travel less are part of the same playbook: short‑term demand management to ease the 2026 oil shock, buying time for structural fixes in energy security and decarbonization.
- Central‑bank trade‑offs: Central banks must decide whether to look through an energy‑driven bump in headline inflation or lean against it aggressively. Tightening into a mostly supply‑driven shock risks amplifying the drag on growth and real incomes; being too relaxed risks re‑anchoring inflation expectations at a higher level.
- Unequal impact: Energy shocks are inherently regressive. Lower‑income households and smaller firms spend a higher share on fuel and electricity, and energy‑importing regions – including much of Europe and large parts of Asia – are squeezed more than net exporters.
For Ireland, the politics of this global oil shock 2026 will be fought less over literal shortages and more over who pays the higher import bill: households (via prices), firms (via margins), governments (via subsidies) or bondholders (via higher risk premia).
What this means for SMEs and policymakers
For SMEs, the message is not to ignore the global oil shock 2026, but to frame it correctly:
- Treat higher energy costs as a manageable but non‑trivial headwind, not an automatic replay of 1970s‑style stagflation.
- Stress‑test business plans against a range of oil prices – including ECB‑style adverse and severe scenarios – rather than anchoring decisions on a single point forecast.
- Focus on what is controllable: energy efficiency, pricing strategy, working‑capital buffers, diversification of suppliers and markets, and, where feasible, shifts toward less energy‑intensive business models.
For policymakers, the global oil shock 2026 challenge is to protect the most exposed without locking in permanent, expensive responses to what may still be a temporary shock. That implies:
- Targeted, time‑bound support for vulnerable households and energy‑intensive SMEs, not open‑ended subsidies.
- Clear communication about the conditional nature of support — tied to prices, not headlines.
- Strong coordination between fiscal and monetary policy so that one does not inadvertently undermine the other.
A different kind of energy crisis
The world is not reliving the 1970s. Instead, it is navigating a different kind of energy crisis: one where geopolitical shocks collide with an ongoing energy transition, a more services‑driven economy, and societies still working through the aftershocks of the pandemic and the 2021–23 inflation spike.
Oil can still “rewrite the script” in the short term. Over the next few years, however, the story will be shaped less by the precise level of oil prices and more by how households, firms and policymakers adapt to another period of volatility in an already strained system – including how quickly they use this uncomfortable moment to strengthen energy security, harden fertilizer and food supply chains, and accelerate pragmatic, security‑driven decarbonization.
If you’d like to receive my next analysis on public policy, economics or business in your inbox, you can leave your details via the contact form here (just mention “subscribe to analysis” in your message):
https://aurexinsights.com/contact-us/
About Aurex Insights
Aurex Insights is an independent economic and public‑policy consultancy founded by Dr Brian O’Donnell, DBA, working with SMEs, NGOs, sectoral bodies and public institutions across Ireland, the EU and Canada.
If your organisation needs to understand what this global oil shock 2026 means for your budget, business model or policy choices, I offer a free initial consultation to scope the options. You can book a free consultation here: https://aurexinsights.com/contact/#Booking-form