
By Dr. Brian O’Donnell, DBA, Founder, Aurex Insights | February 2026
Canada’s manufacturing footprint now sits at ~9.3% of GDP (2024) – low among peers and far below Ireland’s – and it has continued to fall, with 2025 data showing repeated monthly contractions in manufacturing output. While Canada’s internal frictions and under‑investment are suppressing production, Ireland’s FDI‑led strength is real but highly concentrated. The fix on both sides is production‑led resilience.
In 2026, these two advanced economies – Canada and Ireland – confront the same dilemma from opposite directions. Canada, a resource‑rich G7 nation with deep industrial traditions, has seen its manufacturing base steadily erode. Ireland, a small island state with few natural endowments, has become an export powerhouse through FDI and EU market access. Beneath these divergent trajectories lies a shared vulnerability: both have allowed structural fragilities to accumulate beneath headline success.
Canada’s challenge is internal: regulatory accumulation, fragmented domestic markets, and weak investment per worker have dulled competitiveness and slowed project delivery. The IMF estimates internal, policy‑related barriers across provinces are equivalent to an ≈9% tariff, and removing them could raise real GDP by nearly 7% over time – a gain driven largely by services. A new Statistics Canada study finds regulatory provisions increased ~37% between 2006 – 2021, imposing measurable drags on GDP growth (‑1.7pp) and employment growth (‑1.3pp) in the business sector. Canada’s challenge, then, is not capability but coherence – a system structured in ways that make production harder than it needs to be.
Ireland’s challenge is external: over‑concentration in a narrow set of multinational‑driven sectors and a highly concentrated corporate tax base expose the exchequer to volatility. Foreign‑owned MNEs paid ~88% of net corporate tax in 2024, and just ten firms accounted for 57%, underscoring how Ireland’s fiscal strength is anchored in a narrow base. Each model delivered prosperity for decades, but both now face a world in which those models are more exposed to geopolitical, technological, and macroeconomic shocks.
I have seen these dynamics from both sides of the Atlantic – as a former Irish policymaker and now a business and economics adviser – and the comparison isn’t academic. It points to a simple conclusion: middle‑power economies must rebuild resilience through production, not posture. The assumptions that underpinned the last 30 years of growth no longer hold; the economies that will thrive are those that scale domestic production, integrate internal markets, and broaden their enterprise base.
1) Canada’s Industrial Drift
Canada’s manufacturing base has been thinning for years, and the numbers now make the trend unmistakable. Manufacturing accounts for just ~9.3% of Canada’s GDP (2024) – low by OECD Standards and far below Ireland’s share. This erosion is not the result of global forces alone; it is increasingly policy‑made.
The IMF estimates that Canada’s internal, policy‑driven barriers – differences in licensing, standards, procurement rules, and mobility restrictions – function as the equivalent of a ~9% tariff. Removing them would raise long‑run real GDP by nearly 7%, with the largest gains in services and advanced tradable sectors.
These structural frictions are compounded by a regulatory landscape that has grown denser over time. A Statistics Canada study finds regulatory provisions increased ~37% between 2006 and 2021, exerting measurable drags on GDP growth (‑1.7pp) and employment growth (‑1.3pp) across the business sector. And sector‑level evidence shows even sharper escalation: manufacturing‑specific requirements now exceed 105,000, up 42% since 2005 -an accretion that raises costs, delays projects, and reduces competitiveness.
Taken together, the picture is one of fragmentation and friction – a system that increasingly makes production harder than it needs to be. Canada’s challenge is not capacity, but coherence.
Figure 1. Manufacturing Value Added (% of GDP), 2024 — Ireland vs Canada
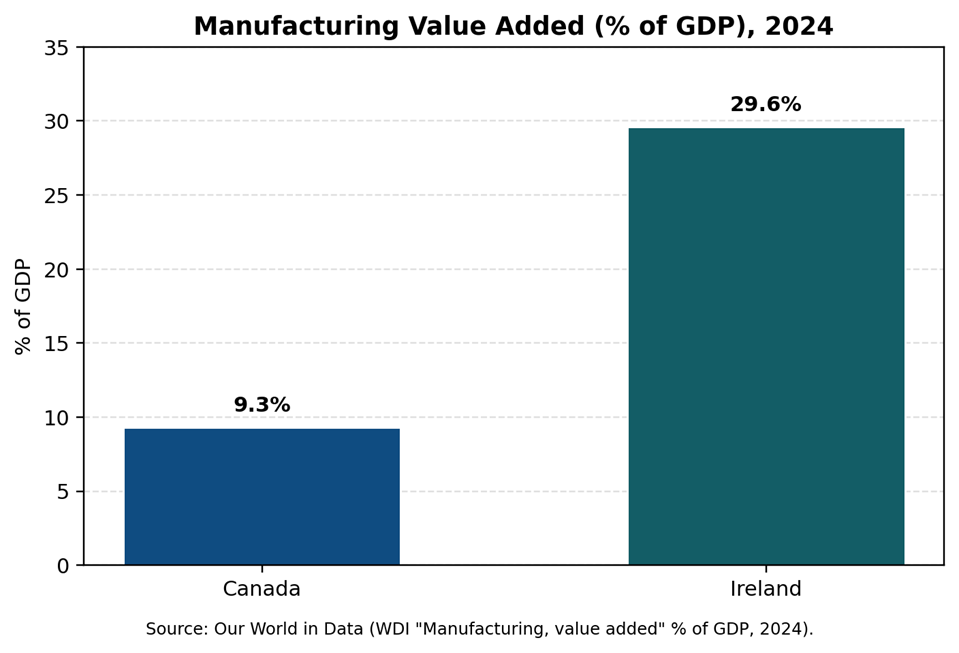
Why it matters: Advanced manufacturing, energy infrastructure, and critical‑minerals processing are capital‑intensive sectors. When an economy is fragmented -as Canada’s is – these projects become costlier and slower to deliver. Regulatory duplication and internal barriers raise the cost of scaling precisely the industries needed to close Canada’s gaps in capital per worker and productivity.
2) Ireland’s FDI‑Powered Ascent – and Its Concentration Risk
Ireland today is one of the world’s most export‑intensive economies. Chemicals and related products accounted for nearly two‑thirds of all goods exports in 2023, reflecting the depth of the island’s pharma and biotech platform.
The fiscal picture is equally striking: underlying corporate tax receipts reached €32.9 bn in 2025, up 17% year‑on‑year, driven overwhelmingly by multinational profits.
But the success comes with an acute structural vulnerability. Foreign‑owned multinationals accounted for ~88% of net corporation tax receipts in 2024, and the top 10 companies alone for 57% (excluding the CJEU one‑off). This concentration means that Ireland’s fiscal base – while powerful – is narrow, volatile, and heavily exposed to sector‑specific profit cycles.
At the ruleset level, Pillar Two is now in force: large multinational groups (≥€750M turnover) face a 15% minimum effective tax rate, while the traditional 12.5% rate still applies to most domestic firms.
3) A Concise Snapshot
To understand the structural divergence between the two economies, the table below brings the key indicators together – economic scale, industrial intensity, tax architecture, regulatory load, and market structure.
Table 1 — Structural Snapshot (Canada vs. Ireland)
| Indicator | Canada | Ireland |
| Population | 41.65 million (Jul 1, 2025) | 5.38 million (Apr 2024) |
| GDP (nominal, USD) | $2.28 trillion (IMF 2025 proj.) | $709 billion (IMF 2025 proj.) |
| Manufacturing value added (% of GDP) | 9.3% (2024) | 29.6% (2024) |
| Corporate income tax (general) | ~23%–31% combined (federal 15% + province, 2025) | 12.5% headline; 15% minimum (Pillar Two) for in‑scope MNEs |
| Corporation tax receipts | n/a (federal/provincial split) | €32.9 bn (2025 underlying) |
| Internal barriers to trade | ~9% tariff‑equivalent; +7% GDP if removed | Minimal within EU Single Market |
| SME export participation | 15.1% of SMEs export (2023) | ~18% of goods export value by SMEs (2022) |
| Regulatory load (manufacturing / economy‑wide) | ~105k mfg. requirements (+42% since 2005); provisions +37% (2006–21) | Centralized EU acquis; lower fragmentation |
Sources: Statistics Canada (population), CSO Ireland (population); IMF WEO (GDP); Our World in Data (Manufacturing % of GDP); CRA/RSM (Canada corporate rates); Department of Finance Ireland/RTÉ (CT receipts & Pillar Two); IMF Country Focus (internal barriers); ISED/StatCan (Canada SME exporters); CSO/industry coverage (Ireland SME export share); National Bank Economics & Statistics Canada (regulatory).
What it shows: Ireland’s industrial intensity is high, and Canada’s internal frictions are high.
Ireland’s fiscal engine is strong but narrow, tied heavily to multinational profitability.
Canada’s fiscal base is broad, but its production capacity is under‑performing, constrained by regulatory density and internal fragmentation.
Together, these patterns reinforce the central argument of this analysis: one economy is constrained by concentration, the other by fragmentation – and both must move toward production‑led resilience.
4) SMEs and Exporting – Clearing Up the “6% vs ~19%” Confusion
Two widely circulated statistics about Irish SMEs appear contradictory but are both correct once context is applied:
- The EU SME Fact Sheet (2025) reports that ≈6% of Irish SMEs (≥10 employees) export goods to non‑EU markets. This is a participation rate for a subset of firms and destinations.
- The CSO “Trade by Enterprise Size” (2022) dataset shows SMEs generate ~19% of total goods‑export value, including micro firms and all destinations (EU + non‑EU). This is a value share, not a participation rate.
Taken together, the picture is clear: SME participation is narrow, and export value is concentrated among large MNEs. This reinforces the policy point that Ireland needs deeper domestic enterprise integration, not just FDI‑driven scale.
Table 2 — Policy Exposures & Levers
| Theme | Canada | Ireland |
| External dependence | US trade, commodity cycles; tariff shocks | US MNE earnings; sector cycles in pharma/tech |
| Domestic friction | Internal barriers ≈9% tariff‑equivalent; regulatory accumulation | SME export participation narrow; value concentrated in large firms |
| Immediate levers | Mutual recognition in services; permitting reform; scale capex/worker | Ring‑fence CT windfalls for SME export & supply‑chain programs; diffusion |
Sources: Canada internal markets: IMF Country Focus; StatCan on regulatory accumulation. Ireland SME exporting and value shares: EU SME Fact Sheet 2025; CSO. Ireland CT concentration: Revenue. Sector composition: CSO.
5) What to Do in 2026
Canada and Ireland face different constraints, but their remedies share a common logic: restore productive capacity by clearing the blockages that prevent firms from scaling.
Canada – Execution Over Announcements
- Adopt default mutual recognition across provinces, beginning with services – the area where internal barriers behave like a 9% tariff‑equivalent and hold back most of the lost GDP.
- Consolidate and sunset redundant regulations, using StatCan’s evidence of a ~37% rise in regulatory provisions and National Bank’s count of 105,000+ manufacturing requirements as a guide for where duplication hits hardest.
- Accelerate major‑project permitting in energy, critical minerals, and advanced manufacturing to lift capital per worker and reverse the declining trend in goods‑producing industries.
Ireland – Resilience Over Windfalls
- Ring‑fence a share of corporate tax windfalls – for example 15–20% – into domestic SME export and supplier‑development programs that widen participation beyond multinationals.
- Institutionalize diffusion through standards, clusters, and supplier‑readiness programs so Irish firms can meaningfully integrate into pharma, med‑devices, and tech value chains as Pillar Two stabilizes the tax environment.
The Strategic Imperative
Canada’s energy abundance and Ireland’s FDI engine each offer powerful – but incomplete – foundations for long‑term prosperity. What both economies now confront is a deeper reality: structural fragilities have become strategic liabilities.
Fragmentation in Canada and concentration in Ireland may look like different problems, but they expose both countries to the same risk: an erosion of productive sovereignty in a more volatile world.
Middle‑power economies cannot rely on inherited advantages, favourable tax designs, or the momentum of past growth. They must produce more of what they consume, capture more of what they create, and depend less on policy luck or external actors. The path ahead is not ideological; it is structural.
In 2026, survival depends not on posture, but on production. And prosperity depends on whether Canada and Ireland can convert their strengths into resilience before the window closes.
Aurex Insights advises organizations navigating the shift from fragility to resilience across the EU/North Atlantic economy. Dr. Brian O’Donnell is a former Irish Senator and an economics consultant based between Ireland and Canada. Contact: brian@aurexinsights.com